April 22, 2026
ABA Therapy Industry: Analysis and Opportunities
Overview
Market snapshot
- Demand outstrips capacity; long waitlists and uneven geographic access persist despite rapid workforce growth.
- U.S. industry revenue sits in the low–single-digit billions today (Autism Treatment Centers/ABA services), with high-single-digit growth pre-2022 and a recent moderation tied to labor and reimbursement friction.
- Coverage tailwinds are durable: all 50 states have autism insurance mandates and Medicaid EPSDT requires medically necessary services for children.
- Fragmentation remains high; multi-state platforms exist but most markets are served by small/regional providers.
Demand drivers and coverage
- Rising prevalence and earlier identification: CDC estimates 1 in 36 U.S. children aged 8 has ASD (2020 data published 2023), up from 1 in 44 previously.
- Strong policy support: all states mandate some autism benefits (often including ABA) for state-regulated plans; TRICARE and most Medicaid programs cover ABA (post-2014 CMS guidance under EPSDT).
- Clinical guidance supports early intensive behavioral intervention: AAP notes benefit of intensive (often 25 hours/week) behavioral programs for young children when medically necessary.
Supply constraints and access
- Workforce scaled rapidly but remains capacity-constrained relative to demand. BACB data show multi-year double-digit growth in BCBAs and RBTs (BCBAs up ~3x and RBTs up ~5x since 2018), yet employer demand has outpaced supply in many markets.
- Operational bottlenecks: supervision ratios, therapist turnover, cancellations, and authorization cycles limit realized hours even where demand is high.
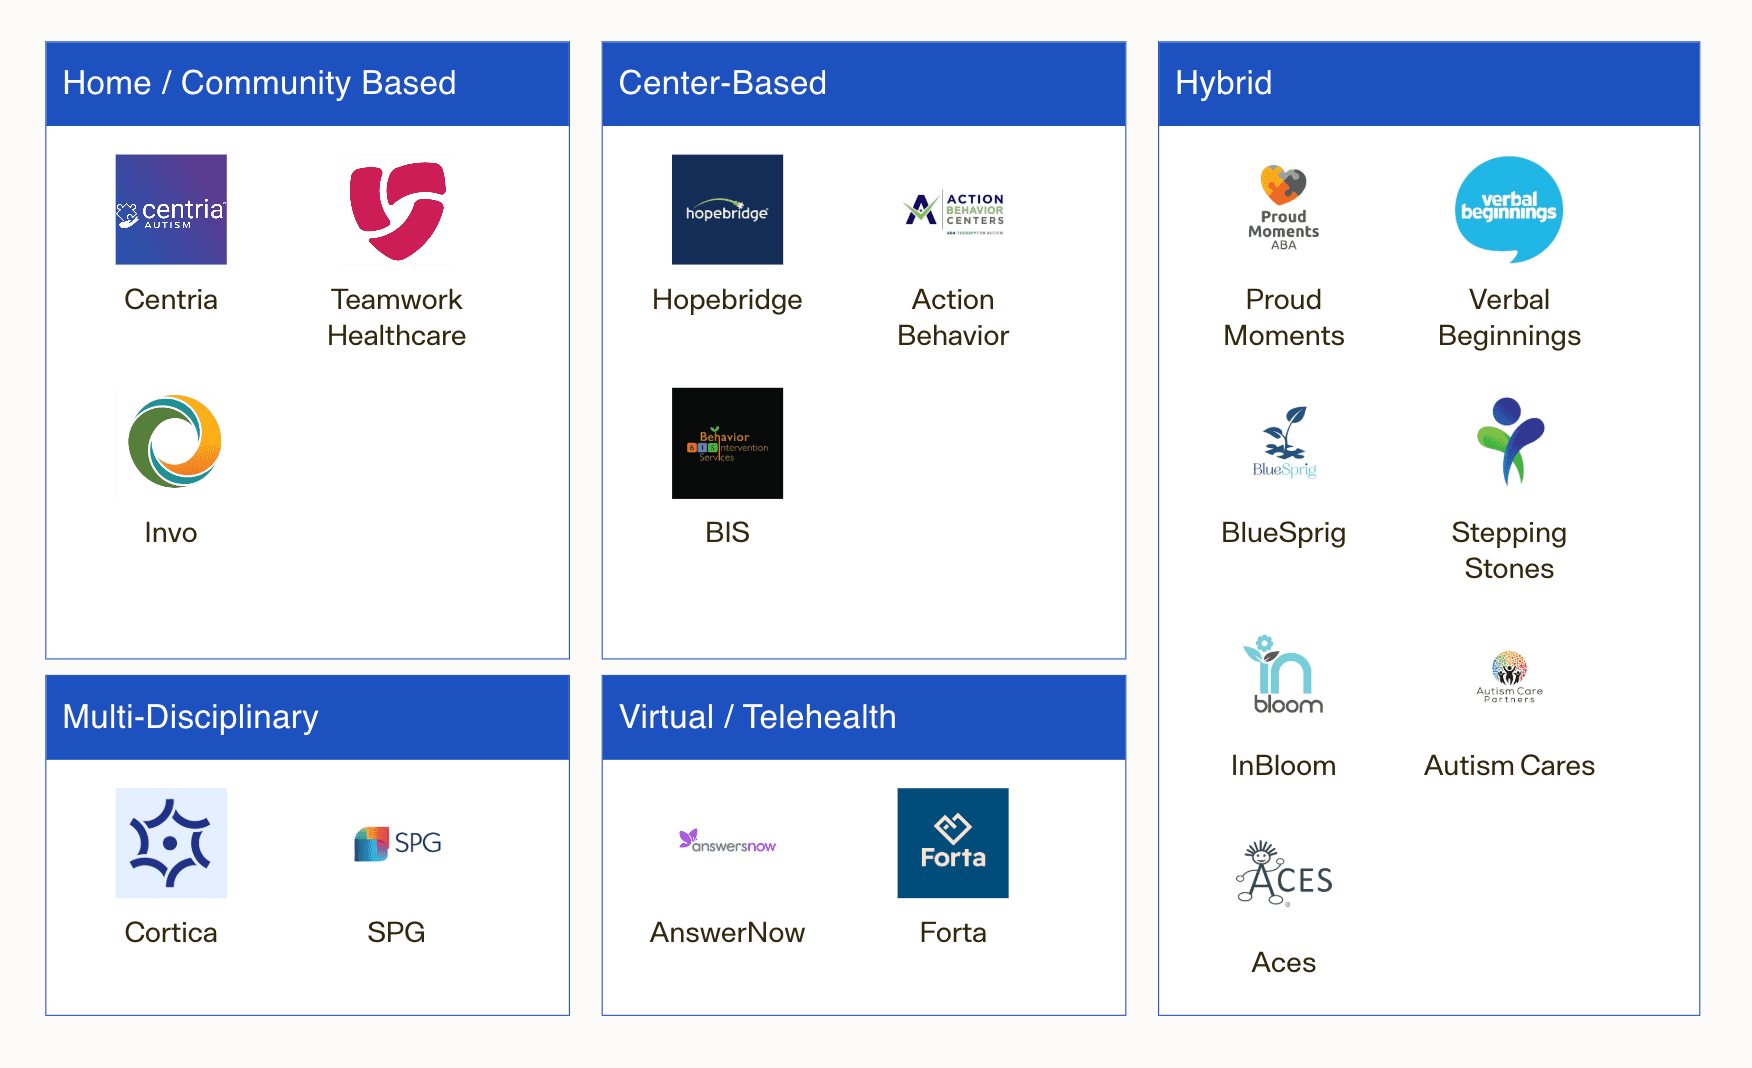
Competitive landscape (examples; not exhaustive)
- National/multi-state platforms: Hopebridge, BlueSprig, Centria Healthcare, Action Behavior Centers, LEARN Behavioral, Autism Learning Partners, Acorn Health.
- Local/regional clinics and in-home providers make up the majority of market capacity; payer panels and school-district relationships drive local share.
Economics and reimbursement (what drives margin)
- Unit economics hinge on: payer mix (commercial vs Medicaid/TRICARE), allowed rate per hour by service type, clinician productivity (billable hours/paid hours), no-show/cancellation rates, supervision mix, and RCM denial/rework.
- Reimbursement remains administratively complex (medical necessity documentation, prior authorization, frequent re-auth, and utilization reviews), creating scale advantages for robust RCM and outcomes tracking platforms.
TAM framework (U.S.)
- Top-down need-based lens (illustrative):
- Pediatric ASD population exposure: applying 2–3% prevalence to the U.S. child population yields a very large cohort eligible for evaluation.
- Clinically indicated hours: guidelines cite intensive programs (often ~25 hrs/week) for some young children; actual delivered hours are frequently lower due to capacity and payer limits.
- Implied “theoretical TAM” (if all clinically indicated children received recommended hours at typical allowed rates) reaches into the tens of billions annually. Realized revenue today is a fraction of this and sits in the low–single-digit billions, reflecting access, workforce, and payer constraints.
- Implication: large headroom remains; growth is constrained more by supply/operations and contracting than by underlying demand.
Investment implications
- Attractive, durable demand with policy support; value creation requires solving for supply and execution.
- Scalable playbooks:
- De novo capacity in supply-constrained suburbs/SMAs with favorable payer mix; co-locate with pediatric primary care and therapy (ST/OT) for referrals and cross-discipline care.
- Targeted M&A to densify state footprints and enhance payer leverage; prioritize assets with strong BCBA pipelines and low cancellation rates.
- RCM and compliance infrastructure (authorization, documentation, outcomes) to reduce denials and speed cash; standardized clinical pathways to support payers’ quality requirements.
- Payer partnerships: multi-state agreements and pilots (e.g., outcomes-linked authorizations) to stabilize utilization and rates.
- Where to be cautious: markets with Medicaid-heavy mix and low fee schedules without offsetting operational scale; overreliance on TRICARE where program design and rates can shift; thin BCBA supervision capacity; weak clinical governance amid rising scrutiny.
Next-step diligence priorities
- Market mapping by state/MSA: waitlists, provider density, payer mix, Medicaid fee schedules and authorization rules.
- Workforce funnel: BCBA/RBT supply, supervision ratios, turnover, training hours to productivity ramp.
- Unit economics: billed vs paid hours, denial rates and reasons, time-to-auth/time-to-cash, cancellation/no-show patterns, center utilization.
- Payer posture: contracted rates vs peers, audit history, recoupments, and outcomes reporting requirements.
- Clinical quality: treatment integrity, parent/caregiver engagement, outcomes tracking; compliance with evolving state licensure.
- Platform scalability: EHR/RCM stack (e.g., outcomes modules), de novo playbook, integration cadence for add-ons, and school-district or health system referral channels.
Business Models
Overview and revenue mechanics
- Core settings
- Clinic-based (center): Children receive 1:1 technician-delivered therapy (often 20–40 hours/week) with on-site BCBA supervision; fixed site costs but higher schedule control and density.
- In-home: Technicians deliver therapy in the family’s home; lower fixed costs but travel time, cancellations, and routing complexity depress utilization.
- School-based/contracted: B2B contracts with districts to staff technicians/BCBAs supporting IEPs; steadier demand but lower rates and academic-year seasonality.
- Payor mix and coverage
- Commercial plans and TRICARE typically reimburse ABA with prior authorization; all 50 states have some insurance mandate for ASD, though scope/age/limits vary by state.
- Medicaid covers ABA for children when medically necessary under EPSDT in many states following CMS 2014 guidance; rates and administrative burdens vary materially by state.
- Billing model: Predominantly fee-for-service using CPT codes for assessment (97151), technician-delivered treatment (97153), BCBA protocol modification (97155), and caregiver training (97156). Limited adoption of value-based models today.
Comparative operating models (decision-focused)
| Model | Typical site/setup | Primary payers | Revenue mechanics | Utilization & throughput | Cost structure | Strategic pros | Structural challenges |
|---|---|---|---|---|---|---|---|
| Clinic-based | Dedicated centers (6–12 therapy rooms); hub-and-spoke supervision | Heavier commercial/Tricare; some Medicaid | FFS CPT mix; higher share of 97153 with on-site density; parent training/supervision blocks consolidated | Better control of schedules; fewer no-shows; grouping enables higher billable hours per tech per day | Higher fixed costs (rent, buildout, admin); staffing for front desk/clinic ops | Higher technician utilization; clinical oversight/quality control; brandable footprint; easier training/onboarding | Site CAPEX, lead times for licensure/COO; local catchment limits; exposure to lease inflation |
| In-home | Decentralized; techs route to families | More Medicaid; commercial in suburban markets | FFS with travel between visits (often non-billable); EVV and per-visit auths in many Medicaid states | Lower realized billable hours per tech due to travel/cancellations; rural spread exacerbates | Variable costs high (mileage, windshield time); lighter fixed overhead | Broad geographic reach; access to families unable to travel; lower startup cost per market | Scheduling complexity; higher denial risk on documentation; workforce retention harder due to solo work |
| School-based/contracted | Technicians/BCBAs embedded in districts | District budgets (IDEA/Medicaid billing by district varies) | Contract rates (hourly/day rates or per-student); steadier volumes across cohorts | School-day schedules; fewer cancellations; 9–10 month calendar (summer dip unless ESY) | Low fixed overhead; recruiting aligned to academic year | Predictable volumes; faster ramp via multi-student contracts; lower RCM burden | Rates typically lower than commercial ABA; procurement cycles; scope constrained by IEPs |
Named operators and footprints (illustrative, not exhaustive)
- Clinic-centric: Hopebridge (multi-state centers), BlueSprig, Autism Learning Partners. Several scaled platforms use hub-and-spoke supervision and standardized center layouts.
- In-home or hybrid: Centria Healthcare, Butterfly Effects, Key Autism Services; many operate both home and clinic to optimize density and family preference.
- School-based/related services: Invo Healthcare, The Stepping Stones Group (broader SPED staffing with ABA capabilities), and regional specialists contracting directly with districts.
Payer and coding considerations
- CPT framework (commonly used):
- 97151 (assessment by BCBA), 97153 (technician-delivered treatment), 97155 (BCBA protocol modification with client present), 97156 (family/caregiver training). TRICARE and many commercial/Medicaid plans reimburse these codes; telehealth reimbursement often persists for 97155/97156, plan- and state-dependent.
- Coverage landscape and demand signals:
- All 50 states have some autism insurance mandate, expanding commercial coverage for ABA; medical necessity/age caps vary by state.
- Medicaid coverage for children expanded post-2014 CMS guidance (EPSDT), but states differ on rates, EVV requirements, and prior auth complexity.
- K–12 demand proxy: NCES reports >800,000 students with an autism classification receiving IDEA services, underscoring school-based opportunity (procurement-driven).
Economics by model — what tends to drive margin
- Revenue yield per clinical hour
- Driven by allowed rate (payer/state), case mix of 97153 vs 97155/97156, and collection yield after denials/recoupments.
- Clinic models generally realize higher billable hours/tech/day due to density and fewer cancels; in-home models lose hours to travel and family schedule volatility.
- Direct labor intensity
- Technician wages are the largest cost line; BCBA time (assessment, supervision, protocol modification) must be carefully scheduled to payer rules.
- Tight labor markets post-2020 increased wage pressure and turnover; operators report persistent hiring challenges for RBTs and BCBAs.
- Overhead and CAPEX
- Clinic: rent/buildout, licensing, equipment; benefits from scale via multi-room utilization and shared admin. In-home: minimal CAPEX but higher scheduling/RTE tech and QA investments. School: light overhead; margin depends on negotiated district rates and staffing efficiency.
- Compliance and RCM
- Prior auth, treatment plan review cadence, EVV (home-based Medicaid), and payer-specific documentation drive denial risk. Operators with robust QA/RCM processes show meaningfully higher collection rates and lower takebacks.
Market signals relevant to business model choice
- Workforce supply/demand: Job postings for behavior analysts grew >5,000% over the last decade+, evidencing structural demand outpacing supply; business models that support supervision leverage (clinic/hub) can mitigate BCBA constraints.
- Payer scrutiny and provider shakeout: A leading clinic operator (CARD) filed Chapter 11 in 2023, citing reimbursement and labor pressures—highlighting the need for rate discipline, density, and RCM rigor.
- TRICARE and large commercial payers standardize CPT usage, enabling multi-state playbooks; state Medicaid heterogeneity argues for selective market entry or school-contract hedges.
Implications for investment thesis
- Scaling advantage favors clinic or hybrid models in dense MSAs: higher utilization, stronger clinical governance, and brand visibility. In-home can be profitable with tight routing, high visit density, and Medicaid operational competence (EVV, documentation) but is more execution-sensitive.
- School-based contracts can smooth demand and diversify payer risk, though rates are typically lower; attractive as an adjacency for platforms with strong recruiting and district relationships.
- Pricing power is limited; value creation comes from mix improvement (more 97155/97156 where clinically appropriate), payer contracting, center density, and RCM excellence (authorization-to-delivery alignment, denial prevention, audit readiness).
- Portfolio construction: prioritize states with robust commercial coverage and viable Medicaid rates; avoid overexposure to any single payer; build supervisory hubs before greenfielding satellites.
Operator diligence checklist (by model)
- All models: authorized vs delivered hours; cancellation/no-show rates; collection yield by payer; denial/recovery trends; clinician turnover and vacancy days; payer rate cards and recent changes.
- Clinic: room utilization by daypart; center-level contribution margin; ramp curve from license to 80% capacity; waitlist conversion; CAPEX per de novo.
- In-home: miles/visit and windshield time; EVV compliance; tech schedule density; weekend/evening mix; safety/incident rates; family training completion.
- School: contract terms (rates, cancel policies), fill rate per FTE, calendar-driven seasonality, payment cycle/DSO, proportion of Medicaid-billable minutes (if any) and who bills.
Select data points to anchor planning
- Prevalence: CDC estimates ASD prevalence at roughly 1 in 36 children (age 8) in 2020 cohorts—sustaining multi-year demand tailwinds.
- Education channel: NCES shows >800k students with an autism classification receiving IDEA services—a sizable base for school-based/adjacent offerings.
- Coverage: 50-state insurance mandates and CMS EPSDT guidance underpin broad reimbursement access; execution and state-by-state rates remain the gating factors rather than coverage existence.
Key Revenue/Margin Drivers
| Driver | How it drives revenue/margin | Examples / evidence | Investment implications |
|---|---|---|---|
| Payer mix & reimbursement levels | Higher allowed amounts typically in commercial plans vs some Medicaid plans; TRICARE has defined national policy; rates vary widely by state and code. | FAIR Health shows significant state-level variation in allowed amounts for ABA CPT codes; all states now have autism insurance mandates expanding covered lives. | Prioritize markets/contracts with favorable commercial mix; negotiate multi-year escalators; monitor Medicaid rate adequacy before entry. |
| Service setting (center vs home/school) | Center-based care reduces travel/non-billable time and enables density and group programming; home-based can be harder to schedule and staff efficiently. | Group ABA codes (97157/97158) allow multiple learners per hour; providers report operational leverage from center hubs in dense markets. | Bias footprint to centers in high-density submarkets; use home-based selectively for access/feeder and rural coverage. |
| CPT code mix (clinical intensity) | Mix of technician hours (97153) and supervisor/QHP hours (97155, 97156) drives revenue per case and margin; documentation quality unlocks billability. | ABA CPT code set 97151–97158 governs billable services; protocol modification (97155) reimbursed at higher rates than technician treatment in many contracts. | Standardize treatment planning and coding; audit charts to ensure medically necessary supervisor services are captured. |
| Supervisory model & caseload | BCBA oversight capacity constrains growth; supervision requirements create non/partially billable time if not coded properly. | BACB requires a minimum 5% monthly supervision of RBT hours; BCBA labor supply is tight. | Design pyramid capacity (BCBA:RBT ratios) to maximize billable supervision while maintaining outcomes; invest in BCBA recruitment and retention. |
| Therapist productivity & retention | Higher billable utilization and lower turnover expand gross margin; churn adds recruiting/training cost and disrupts schedules. | Demand for BCBAs grew ~23x from 2010–2022 (BACB), contributing to wage pressure; industry bankruptcies (e.g., CARD 2023) cited labor inflation as a headwind. | Build career ladders, training, and compensation bands tied to utilization/quality; centralize recruiting; reduce time-to-productivity. |
| Demand funnel & waitlist conversion | Strong inbound demand and long waitlists support rapid center fill and backfilling cancellations. | CDC prevalence now ~1 in 36 children; multiple reports of months-long ABA waitlists in many markets. | Invest in diagnostics/intake to shorten time-to-start; manage waitlists dynamically to lift occupancy and stabilize hours. |
| Authorization, documentation & RCM | Clean prior-auth, accurate coding, and low denial rates shorten DSO and protect margin. | State mandates expand coverage but payers maintain medical-necessity criteria; TRICARE ACD has prescriptive authorization and documentation requirements. | Centralize RCM; track denial root causes by code/payer; deploy documentation QA and payer-policy playbooks. |
| Geographic/regulatory selection | State mandates, Medicaid coverage implementation, licensure/scope rules, and local wage floors change unit economics. | All 50 states have autism insurance coverage laws; Medicaid EPSDT requires medically necessary services for children, but rates/implementation vary. | Enter states/counties with favorable reimbursement, workforce supply, and licensing regimes; avoid markets with persistently low rates absent scale advantage. |
| Scheduling density & cancellations | High density reduces therapist idle time; strong attendance policies and flexible scheduling lower cancel/no-show drag. | Long market waitlists enable backfill when operations are nimble; group sessions can mitigate sporadic cancels. | Use overbooking rules, predictive scheduling, and SMS confirmations; colocate cases to reduce dead time. |
| Adjacent services (ST/OT, diagnostics) | Multidisciplinary offerings increase ARPU per family and reduce leakage; in-house diagnostics accelerate intake. | Diagnostic bottlenecks often delay ABA start; adding ST/OT creates cross-referrals and payer stickiness. | Stand up assessment clinics and ST/OT where contract rates support margin; bundle care pathways. |
| Payer concentration & audit risk | Rate cuts or post-payment audits from a concentrated payer panel can compress margins quickly. | CARD’s 2023 bankruptcy highlighted sensitivity to payer rate dynamics; insurers have increased utilization management in ABA. | Diversify payer mix; negotiate audit protocols; build compliance analytics to preempt recoupments. |
| Telehealth enablement (select codes) | Tele-supervision/parent training where allowed reduces travel and broadens clinician reach. | Many payers adopted telehealth flexibilities during COVID; ongoing coverage varies by payer/state and code (e.g., 97156). | Maintain telehealth-ready workflows; contract for tele-covered codes; monitor policy sunsets by payer. |
| Scale ops & procurement | Centralized intake, RCM, training, and benefits purchasing reduce SG&A per hour; standardized curricula cut variance. | Larger platforms can negotiate better benefits and software rates; process standardization improves margins. | Pursue tuck-ins to gain local density; codify playbooks and KPIs at the center level. |
Pricing
How ABA is priced (coding and units)
- Predominantly fee-for-service, billed in 15-minute units using CPT codes. Core revenue drivers:
- 97153 (technician-delivered adaptive behavior treatment; RBT/BT under BCBA)
- 97155 (BCBA-delivered treatment with protocol modification)
- 97151 (initial behavior identification assessment)
- 97156 (family adaptive behavior treatment guidance)
- 97158 (group adaptive behavior treatment)
- Payers: commercial (national and Blues), Medicaid (state-specific fee schedules), and TRICARE’s Autism Care Demonstration (ACD). Out-of-network and cash-pay exist but are a minority of volume in most scaled platforms.
Typical in-network allowed-amount ranges (per hour; illustrative)
- These ranges reflect publicly posted state Medicaid schedules (e.g., MA 101 CMR 358, Texas TMHP) and TRICARE/industry policy documents; commercial often pays at or above local Medicaid/TRICARE benchmarks.
| Service (CPT) | Typical allowed-amount range (per hour) | Notes/examples |
|---|---|---|
| 97153 – Technician 1:1 | ~$55–$85 | State Medicaid schedules commonly translate to low-to-mid $60s/hour; commercial often 10–40% higher, depending on market density and network needs. |
| 97155 – BCBA protocol modification | ~$110–$150 | Often paid at ~2x 97153 on Medicaid schedules; commercial/TRICARE typically similar or modestly higher. |
| 97151 – Assessment | ~$100–$160 | Billed in 15-min units; some payers cap total hours per assessment episode. |
| 97156 – Caregiver training | ~$60–$120 | Increasingly emphasized by payers; utilization managed and sometimes limited per month. |
| 97158 – Group | ~$30–$60 per member | Reimbursed per member per 15-min unit or hour; payer adoption/authorization varies. |
Notes on variability and benchmarks
- Medicaid: States publish fee schedules with per-15-minute rates; when converted, many cluster around the ranges above (e.g., MA 101 CMR 358, Texas TMHP). Verify local schedules; some states pay materially below/above peers.
- TRICARE ACD: National program with defined ABA coverage; allowed amounts for key codes typically align with Medicaid-to-lower-commercial levels. Regional contractors and periodic program updates can affect rates and utilization controls.
- Commercial: Negotiated by market. FAIR Health consumer estimates indicate wide dispersion by ZIP code; in many large metros, in-network allowed amounts for 97153 map into the ranges above, with higher BCBA differentials.
Patient cost share and cash-pay
- In-network OOP: Families often face deductibles and 10–30% coinsurance until hitting plan OOP maximums (employer plans commonly cap single OOP in the mid-$4k range; family caps higher). High-deductible plans can front-load OOP early in the plan year.
- Out-of-network: Diminishing relevance as major payers have broad ABA networks; remaining OON cases face higher OOP and administrative friction.
- Cash-pay: List prices typically exceed in-network allowed amounts; used selectively (waitlist bridging, assessments). Local market checks required; public, standardized cash lists are uncommon.
Market pricing trends to underwrite
- Rate growth lagging wage inflation: Providers report stagnant or slow-growing rates vs. rapid RBT/BCBA wage increases since 2021, compressing margins; several large providers have cited reimbursement pressure alongside labor costs in public disclosures.
- Tightening utilization management: More stringent prior auth, periodic re-assessments, and hour caps (especially on 97155 and assessments); payers emphasizing caregiver training and clinically justified intensity.
- Case-rate and value-based pilots: Some payers are testing weekly case rates or outcome-linked models; still a small share of volume but may expand in concentrated markets.
- Geographic bifurcation: Sunbelt and fast-growth metros often see stronger commercial rate ladders vs. Medicaid-heavy states with slower updates; TRICARE presence can stabilize rates in military catchments.
Illustrative revenue math (for sensitivity)
- Clinic delivering 20,000 technician hours/year (97153):
- Every $5/hour change in allowed amount shifts revenue by ~$100k; at 30,000 hours, impact is ~$150k. Small per-hour moves materially affect EBITDA in multi-site footprints.
- Typical program mix example (not a market average): 85–90% of billed hours 97153; 5–10% 97155; balance caregiver/group/assessment. Contract rules can alter mix economics (e.g., limits on 97155).
Implications for the investment thesis
- Pricing diligence priority: Build a payer-by-state rate ladder (97153/97155/97156/97151) and trended history vs. wage growth; explicitly model 5–10% downside on allowed amounts and UM tightening.
- Contracting upside: Identify markets where commercial is near Medicaid/TRICARE; targeted renegotiations or selective payer pruning can lift yield per hour.
- Mix and scheduling levers: Improve 97155 capture (within medical-necessity), optimize caregiver training throughput, and reduce non-billable time; these can add 200–400 bps to gross margin without rate changes.
- Market selection: Favor states with transparent, regularly updated Medicaid rates and balanced commercial mix; de-prioritize regions with chronic under-indexing unless low-cost delivery is proven.
- TRICARE adjacency: Proximity to military bases can diversify payer mix and stabilize pricing; confirm ACD contractor policies and local allowed amounts.
Key references for pricing benchmarks and coding
- Public Medicaid schedules (e.g., Massachusetts 101 CMR 358; Texas TMHP) define per-15-minute base rates used in the ranges above; TRICARE ACD and national commercial policy bulletins define covered codes and UM norms.
Unit Economics
Key drivers of unit economics
- Revenue is primarily a function of: (1) patients on caseload, (2) authorized and attended hours per patient per week, and (3) realized reimbursement per hour by CPT code and payer.
- Most billable volume is technician-delivered treatment (CPT 97153), supplemented by BCBA adaptive behavior treatment (97155) and caregiver training (97156). Clinical recommendations often target 20–40 hours/week for young children, but actual authorized/attended hours vary by payer, state, and acuity.
How hours translate to revenue and margin
- Revenue per patient (weekly): ≈ [Attended 97153 hrs × allowed $/hr × collections%] + [Attended 97155/97156 hrs × allowed $/hr × collections%]. The 97153 block typically contributes the majority of units.
- Gross margin per billable hour (simplified):
- Margin/hr ≈ (Net realized rate/hr) − (RBT fully loaded cost/hr) − (Allocated BCBA supervision cost/hr) − (facility or travel overhead/hr).
- Key levers:
- Attendance/utilization: A 10-point improvement (e.g., 80%→90%) in attended hours with fixed staffing lifts realized revenue per patient ~12–13% and materially improves labor absorption.
- BCBA-to-technician leverage: Higher sustainable technician hours per BCBA reduces allocated supervision cost per hour (within clinical/payer constraints).
- Payer/code mix: Medicaid fee schedules for ABA codes (e.g., 97153/97155/97156) are commonly below commercial and TRICARE in many states; different code mixes and rates shift blended yield per hour. Published state schedules and TRICARE policy confirm code structure; exact rates vary materially by geography and plan.
Setting (center-based vs. home-based) impacts unit costs
- Center-based:
- Pros: Higher schedule density, less drive time, tighter start/stop times → higher therapist utilization and lower overhead per hour.
- Cons: Facility lease/fit-out and front-desk costs; zoning and capacity constraints.
- Home-based:
- Pros: Access to broader geography and payer demand; clinically appropriate for certain families.
- Cons: Travel time, tighter authorization windows, and higher no-show/cancellation drag reduce realized hours; supervision is operationally heavier.
Operational factors that move the P&L
- Authorization management: Align scheduled hours to approved hours; recover denials quickly. Under-authorized cases cap revenue per patient regardless of demand.
- Cancellation/no-show management: Same-day backfilling, cluster scheduling, and waitlist activation protect utilization.
- Workforce model: Wage escalation for RBTs and BCBAs compresses spread unless offset by pricing/mix, center density, or supervision leverage.
- Collections discipline: Clean coding across 97153/97155/97156, prior auth, and first-pass claim accuracy drive net collections and DSO.
Implications for underwriting and value creation
- Diligence focus areas:
- Hours per patient: Distribution of authorized vs. attended hours; attendance rate by payer/setting; trend vs. staffing capacity.
- Rate realism: Blended net yield per hour by payer and code; compare to state Medicaid schedules and any TRICARE/commercial contracts.
- Labor economics: Fully loaded RBT/BCBA cost per clinical hour; supervision ratios compliant with payer/clinical policy; turnover and backfill time.
- Site mix: Center vs. home margin differential after overhead; scheduling density by site; drive-time leakage.
- Near-term levers post-close:
- Shift mix to higher-density center hours where clinically appropriate; tighten schedule adherence and backfill.
- Improve authorization workflows and RCM to lift net collections and reduce write-offs.
- Optimize BCBA span and case assignment while maintaining outcomes and payer compliance.
- Target states/markets with favorable published fee schedules and commercial payer rates before adding capacity.
Notes on rates and hours
- Clinical intensity for young children is commonly referenced at 20–40 hours/week; however, payers may authorize fewer hours and family attendance varies, so realized hours can be materially lower than clinical recommendations.
- Specific reimbursement rates for 97153/97155/97156 differ by state and payer and are documented in state Medicaid fee schedules and TRICARE policy; use local schedules/contracts for precise underwriting assumptions rather than national averages.
Total Addressable Market (TAM)
Key takeaways for deal team
- US demand TAM for center- and home-based ABA therapy is approximately $12–13B in a base-case today, with a plausible range of ~$5–28B depending on adoption, hours, and reimbursement. A workforce-based cross-check suggests current revenue capacity of ~$9–12B, indicating the market is near capacity in several regions.
- Structural growth drivers: rising ASD diagnosis prevalence (CDC: 1 in 36), near-universal insurance mandates, and gradual rate/acuity mix lift. Constraints: clinician supply (RBT/BCBA), payor authorizations, and care model productivity.
Scope and population basis (United States)
- Target population: children/adolescents requiring medically necessary ABA (core commercial offering). Adult ASD treatment is a smaller, growing adjacency and excluded from base TAM.
- Two anchors used to bound eligible population:
- Prevalence anchor: CDC reports ASD prevalence of ~1 in 36 among 8-year-olds; applied as a proxy across the child population.
- Services anchor: Students served under IDEA with an autism classification (captures a large share of school-age ASD but not all diagnoses).
Methodology and key assumptions (bottom-up)
- TAM = (Eligible ASD population) × (Share receiving ABA in a year) × (Avg weekly ABA hours delivered) × (Weeks) × (Blended allowed $/hour)
- Inputs and sources/assumptions:
- US children under 18 ≈ 73M (Census). CDC prevalence implies ~2.0M children with ASD (73M ÷ 36 ≈ 2.0M). As a conservative services floor, NCES reports ~0.9M students with autism served under IDEA.
- Share receiving ABA annually (assumption due to limited national claims visibility): 15–35% of diagnosed children, reflecting state mandates (all 50 states + DC) versus access constraints (workforce, authorizations).
- Intensity: CASP guidelines indicate focused (5–15 hrs/wk) and comprehensive (20–40 hrs/wk) programs; delivered averages are typically lower than guidelines given staffing and payer utilization controls. Scenarios use 6–12 hrs/wk to reflect a blended, real-world mix.
- Blended allowed amounts per patient-care hour (RBT + BCBA mix, excluding assessments): $50–$65/hr range, reflecting variability across Medicaid and commercial fee schedules and TRICARE Autism Care Demonstration. Exact rates vary by state/plan.
Bottom-up demand TAM (children/adolescents)
Using CDC prevalence base (~2.0M ASD children) and scenario ranges:
| Scenario | Share receiving ABA | Avg hrs/week | Blended $/hr | Implied $/patient/yr | Implied patients (M) | TAM (approx) |
|---|---|---|---|---|---|---|
| Low | 15% | 6 | $50 | ~$15.6k | 0.30 | ~$4.7B |
| Base | 25% | 8 | $60 | ~$25.0k | 0.50 | ~$12.5B |
| High (unconstrained) | 35% | 12 | $65 | ~$40.6k | 0.70 | ~$28.4B |
Notes:
- Weeks assumed = 52; “blended $/hr” includes technician hours plus supervisory mix at billed-hour equivalence. High case reflects demand-side potential if access constraints eased.
Supply-side cross-check (workforce capacity)
- RBT and BCBA supply (BACB): 200k+ RBTs and 60k+ BCBAs in 2024.
- Capacity model (illustrative):
- RBT billed clinical hours: 18–22 hrs/week × 48 weeks × 0.75–0.85 utilization ⇒ ~650–900 billed hrs/RBT/year.
- Total billed hours: with ~200k RBTs ⇒ ~130–180M billed hours/year.
- Revenue capacity: × blended $55–$65/hr ⇒ ~$7–$12B; adding BCBA-only/assessment billing can lift by ~10–20%, yielding a field capacity band of roughly ~$9–$12B today.
- Implication: Base-case demand TAM (~$12–13B) is directionally consistent with current workforce-limited revenue capacity, supporting a thesis that growth requires talent acquisition, retention, and productivity improvements (e.g., scheduling density, supervision leverage, payer mix).
Sensitivity and key TAM drivers
- Most sensitive levers (elasticity):
- Adoption (±5 ppt) ≈ ±$2–3B on base TAM.
- Hours delivered (±2 hrs/wk) ≈ ±$3–4B on base TAM.
- Blended rate (±$5/hr) ≈ ±$1.3–$1.6B on base TAM.
- Structural drivers: prevalence uplift (diagnosis acuity/age), expansion into adolescents/adults, payer rate updates, and telehealth-enabled supervision.
ASCII plot: demand TAM scenarios (approximate)
$30B |                            ███████████████████████
$25B |                     ██████████████████
$20B |               ███████████████
$15B |         ███████████
$10B |   █████████
 $5B | ████
       Low (~$4.7B)   Base (~$12.5B)   High (~$28.4B)
Methodological caveats and data gaps
- National claims-based ABA utilization and average hours are not publicly consolidated; scenario shares (15–35%) and hour assumptions (6–12/wk) reflect triangulation from coverage mandates, clinical guidelines, and observed capacity constraints rather than a single definitive dataset.
- Reimbursement varies materially by state and payer; blended rate range ($50–$65/hr) is supported directionally by public fee schedules and TRICARE program materials but should be validated in target states and top payers.
Implications for investment thesis / next steps
- Near-term growth is constrained more by talent and payer processes than by end-demand; upside TAM realization requires:
- State-by-state rate diligence: confirm allowed amounts for CPT 97153/97155 and authorizations at top-10 target states (commercial and Medicaid MCOs).
- Workforce pipeline: RBT recruiting density vs local demand; supervision ratios; compensation benchmarking.
- Productivity: no-show rates, scheduling density, travel routing (home-based), and clinician utilization.
- Payer mix optimization: contracting with MCOs where rates and denial rates support margins; explore TRICARE footprint if favorable.
- Adjacent TAM: adults with ASD, school contracts (IEP-related services), and complementary services (speech/OT) can incrementally add 10–30% to revenue per case in mature markets; quantify locally.
Market Growth
Key demand, coverage, and capacity signals
- Prevalence: CDC’s ADDM network reports autism prevalence among U.S. 8‑year‑olds rose from 1 in 54 (2016) to 1 in 44 (2018) to 1 in 36 (2020), implying a multi‑year increase in diagnosed need.
- Coverage: All 50 states enacted autism insurance mandates by ~2019; Medicaid coverage expanded following CMS’s 2014 EPSDT guidance; TRICARE operates a nationwide Autism Care Demonstration. These changes structurally expanded reimbursable demand.
- Workforce capacity: BACB data show rapid multi‑year growth in certificants (BCBA/BCaBA/RBT), enabling supply expansion; growth remains uneven by state.
Historical growth (indicative)
- 2014–2019: High-teens to ~20%+ annual growth as state mandates phased in, Medicaid programs implemented ABA benefits, and supply scaled (as evidenced by rapid BACB certificant growth). No single authoritative revenue series exists; this range triangulates coverage adoption timelines, workforce growth, and operator disclosures.
- 2020–2021: Low‑ to mid‑teens growth despite COVID disruptions; demand backlogs built in many markets.
- 2022–2023: Growth moderated to mid‑single digits for many operators amid wage inflation, staff shortages, tighter utilization management, and isolated failures (e.g., CARD’s 2023 bankruptcy), suggesting cyclic normalization after the policy-driven ramp.
Sizing and near‑term TAM (U.S.)
Assumption-driven estimate; ranges reflect uncertainty and state/payer variability.
- Population base: Ages 3–17 ~53–56M (U.S. Census). CDC prevalence 2.8% (1 in 36) implies ~1.4–1.6M children with ASD; adults add additional long‑term need but are a smaller share of reimbursed clinic‑based ABA hours today.
- Service penetration (clinic-/home-based ABA reimbursed by health plans): 15–25% of ASD children near term (supply and eligibility constraints; limited national utilization data).
- Average delivered intensity: 8–15 hours/week of technician-delivered therapy plus supervision; ~48 weeks/year.
- Realized blended rate: Assumption $50–$65 per delivered hour (Medicaid/TRICARE fee schedules are often in this band; commercial plans typically higher but mix‑adjusted rates vary).
- Implied near‑term realized revenue (2024E): Approximately $6–12B, midpoint near ~$9B. Method: patients (0.23–0.40M) × hours (384–720/yr) × blended rate ($50–$65/hr). Note: A wider theoretical TAM (>$15B) is feasible as penetration and hours rise, but workforce and authorization constraints limit near‑term realization.
5‑year outlook (2025–2030E)
- Base case CAGR: ~8–10% driven by (a) continued prevalence/diagnosis growth, (b) gradual penetration gains (Medicaid program maturation, network build‑out), and (c) capacity additions (BCBA/RBT supply). Real pricing likely flat in nominal terms for Medicaid; modest mix/acuity lift possible in commercial.
- Upside case CAGR: ~10–14% if (a) payer friction eases, (b) tech‑enabled productivity improves utilization and retention, and (c) multi‑site operators accelerate de novo expansion in under‑served metros.
- Downside case CAGR: ~3–5% if (a) reimbursement pressure intensifies, (b) staffing shortages persist, or (c) authorization/utilization management further tighten.
What this means for an investment thesis
- Growth is still driven primarily by capacity and access, not price. Under‑served states/metros with mandate coverage and Medicaid EPSDT alignment are the most actionable de novo opportunities.
- Returns hinge on workforce acquisition and retention (BCBA leadership density, RBT pipelines) and payer diversification/RCM discipline to manage denials and authorization volatility.
- State program heterogeneity creates dispersion in unit economics; prioritize states with clearer coverage policies and adequate Medicaid rates; TRICARE exposure adds stability in certain markets.
Plot – Observed ASD prevalence (CDC ADDM)
Year,Prevalence (1 in X),Estimated Prevalence (%)
2016,54,1.85
2018,44,2.27
2020,36,2.78
Plot – Scenario: U.S. ABA therapy revenue (realized), 2024 baseline with CAGR ranges
Note: Scenario based on the assumptions above; there is no authoritative national ABA revenue series.
Year,Low (4% CAGR),Mid (9% CAGR),High (12% CAGR)
2024,6.0,9.0,12.0
2025,6.2,9.8,13.4
2026,6.5,10.7,15.0
2027,6.8,11.7,16.8
2028,7.1,12.8,18.8
2029,7.4,13.9,21.1
2030,7.6,15.1,23.6
Notes and data gaps to resolve
- No public, ABA‑specific NAICS revenue time series; refine with payer claims (e.g., ABA CPT code volume) or triangulate from top‑provider audited financials and state Medicaid utilization reports.
- Penetration/utilization by state and payer (hours per member per year, approval ratios) would sharpen the TAM and CAGR ranges materially.
Regulation
Federal frameworks that shape coverage and payment
- Medicaid EPSDT: CMS directed states (2014) to cover medically necessary ASD services for beneficiaries under 21, which many states implement to include ABA. Translation: Medicaid is a durable demand driver, but rates and admin burden vary widely by state program.
- MHPAEA (Parity): Requires parity between mental/behavioral health and medical benefits for large-group plans and Medicaid managed care — limiting arbitrary visit caps or higher cost sharing for ABA. Enforceability continues to increase via DOL audits and new rulemaking, curbing plan-level restrictions that depress utilization.
- ACA Essential Health Benefits (EHB): Individual and small-group plans must cover behavioral health treatment per state benchmark plans; in many states this includes ABA for ASD. Coverage is not uniform across benchmarks; benefit definitions and UM policies still drive variation in access and cost.
- IDEA (education): Schools must provide FAPE under IDEA; ABA may be part of an IEP but is educational, not a medical insurance benefit. Providers relying on school-funded ABA face distinct contracting, staffing, and reimbursement dynamics versus medical payers.
- TRICARE Autism Care Demonstration (ACD): TRICARE covers ABA through ACD with evolving documentation, outcomes-tracking, and supervision rules. Material payer exposure in military-density markets; policy shifts can impact revenue cycle and staffing models.
State insurance mandates (coverage breadth vs. practical access)
- All 50 states and DC have autism insurance laws; many explicitly include ABA. However, scope (age limits, dollar caps, visit limits) and medical-necessity language vary by state, creating heterogeneous revenue potential and clinical intensity requirements across footprints.
- ERISA preemption: State mandates do not apply to self-funded employer plans (≈ two-thirds of covered workers), making local market mix and payer contracting more determinant than the presence of a state mandate alone.
- Medicaid implementation: Following CMS’s 2014 guidance, states adopted differing fee schedules, prior-auth rules, and provider qualifications. Margin profiles can swing meaningfully by state based on rate-setting and administrative overhead.
Licensure and workforce regulation
- Licensure adoption: Most states (35+ and growing) license behavior analysts (e.g., TX, NY, MA, AZ, VA). Not all states license BCBAs (e.g., California lacks a distinct behavior analyst license as of recent updates), impacting supervision authority, payer credentialing, and risk of practice restrictions.
- Credentials and supervision: BACB credentials (BCBA/BCaBA/RBT) are the de facto baseline; payers and states often hard-code supervision ratios, direct vs. indirect service rules, and scope-of-practice. Noncompliance risks claim denials, recoupments, and licensing actions.
- Facility/agency requirements: Some states require behavioral health clinic licensure or enrollment standards for Medicaid and TRICARE (e.g., background checks, policies/procedures, incident reporting), adding fixed compliance costs to de novo and M&A roll-ups.
Utilization management and billing standards
- Standardized coding: Widespread adoption of CPT 97151–97158 for assessments, treatment, and supervision created a common billing spine, but payers apply variable unit caps, documentation standards, and re-auth frequencies.
- Medical-necessity criteria: Large commercial payers (e.g., United/Optum) maintain detailed ABA policies (diagnosis by qualified clinician, functional impairment, treatment plan requirements, periodic outcome measures). These criteria drive admin load and can constrain hours authorized, particularly for teens and low-intensity cases.
- Rate dispersion: Commercial rates typically exceed Medicaid; spreads can be material and determine site selection. State-set Medicaid rates and managed-care carve-ins/out dictate achievable EBITDA per clinical FTE.
Selected regulatory levers and investor relevance
| Regulatory lever | What it does | Investor relevance |
|---|---|---|
| Medicaid EPSDT | Mandates medically necessary ASD services under 21 | Durable demand; rates/admin vary by state → focus on state mix and contracting strategy |
| MHPAEA parity | Limits unequal quantitative and non-quantitative limits | Supports authorization volumes; diligence payer parity compliance and denial rates |
| ACA EHB | Requires behavioral health coverage in individual/small-group | In EHB states that include ABA, enhances addressable commercial lives; benchmark details matter |
| State autism mandates | Require autism benefits; many include ABA | Not binding on self-funded plans; evaluate local covered-lives mix and employer base |
| State licensure of BAs | Defines who can practice/supervise ABA | Affects staffing pipelines, supervision models, and payer credentialing risk |
| TRICARE ACD | Covers ABA with evolving reporting/supervision | Exposure to policy changes; additional admin overhead but stable demand near bases |
| CPT 97151–97158 | Standardizes billing for ABA | Facilitates multi-payer RCM; payer-specific UM still key driver of cash conversion |
Implications for investment thesis
- Market access anchored by mandates, but revenue realization hinges on payer mix. Prioritize MSAs with high fully insured small-group/individual penetration, robust Medicaid rates, or TRICARE density; discount markets dominated by self-funded ERISA plans with restrictive UM.
- State selection is a margin decision. Target states with (a) behavior analyst licensure in place, (b) Medicaid rates and policies supportive of RBT-delivered hours under BCBA supervision, and (c) manageable prior-auth cadence (e.g., 90-day vs. 30-day re-auth).
- Build compliance as a capability. Centralize documentation templates to meet top-5 payers’ ABA guidelines; align supervision ratios with the strictest state; monitor parity audits and TRICARE ACD updates to preempt denial spikes.
- Workforce moat via licensure-savvy recruiting. Partner with universities and interstate licensure portability pathways; expand RBT pipelines in states with licensure plus broad payer credentialing to unlock authorized hours.
Diligence questions (next steps)
- Payer mix by state: share of Medicaid, fully insured, self-funded, TRICARE; denial/authorization rates and average approved hours by payer.
- Rate and UM benchmarking: Compare contracted rates and re-auth requirements to state medians; quantify revenue at risk from parity noncompliance disputes or TRICARE policy shifts.
- Licensure/status by footprint: Which sites operate in states without LBA licensure; any workarounds (e.g., practice under other licenses) that elevate regulatory risk?
- Compliance posture: Supervision documentation, treatment plan reviews, outcomes tracking (especially for TRICARE ACD), and internal audit cadence.
- RCM throughput: Clean-claim rate by payer, days-to-auth, days-sales-outstanding split by Medicaid vs. commercial; exposure to recoupments from post-payment reviews.
Macro (Headwinds/Tailwinds)
Tailwinds: demand and coverage expanding
- Rising prevalence and earlier identification
- CDC’s latest ADDM data (2020 cohort, published 2023) estimates 1 in 36 U.S. 8‑year‑olds have ASD (≈2.8%), up from 1 in 44 previously, implying sustained growth in eligible populations and longitudinal demand through adolescence.
- Broad insurance coverage architecture now ubiquitous
- All 50 states and DC have laws requiring state‑regulated plans to cover autism services (often explicitly ABA), reducing historical coverage gaps and improving billable mix.
- Medicaid EPSDT guidance (2014) directs states to cover medically necessary autism services (including ABA) for beneficiaries under 21, expanding payer access in lower‑income populations.
- TRICARE Autism Care Demonstration (extended to 12/31/2028) maintains a large federal payer for military families while pushing standardization and outcomes measurement.
- Clinical endorsement supports continued payer willingness
- The American Academy of Pediatrics identifies ABA‑based interventions as evidence‑based and recommends early intensive behavioral and parent‑mediated therapies, sustaining medical‑necessity criteria.
- Workforce capacity growing from a low base
- BACB data show sustained, multi‑year increases in demand for behavior analysts and rapid growth in certificants (BCBAs/RBTs), enabling incremental capacity buildout even as shortages persist.
- Telehealth normalization (select services)
- Many states/payers now allow tele‑supervision and caregiver training via telehealth, improving clinician productivity and geographic flexibility (policy varies by state and code).
Headwinds: reimbursement, labor, and regulatory friction
- Reimbursement pressure and utilization management
- Medicaid coverage does not equate to sustainable unit economics; rates are often tight relative to rising wage floors, and managed care prior auth/clinical recertification requirements add admin costs and denial risk.
- Commercial payers continue to refine CPT 9715x policy, session authorizations, and outcome documentation, raising revenue‑cycle complexity.
- Labor constraints and cost inflation
- Persistent shortages of BCBAs/RBTs, high turnover, and wage competition from schools and other pediatric services compress margins and cap new‑site ramp speed.
- Administrative and compliance load increasing
- TRICARE’s program emphasizes standardized outcomes reporting; states are adding documentation rigor. Electronic Visit Verification (EVV) requirements for in‑home services in many Medicaid programs add operating friction.
- Market credibility and payer scrutiny
- Federal stakeholders have scrutinized effectiveness and value for specific sub‑populations and settings, fueling tighter utilization controls and outcomes expectations.
- Capital markets and consolidation risk signal execution sensitivity
- High‑profile provider distress (e.g., CARD’s 2023 bankruptcy and asset sale) highlights fragility of models exposed to weak payer mixes, underperforming sites, or undisciplined growth.
Market size/TAM framing (use to prioritize diligence)
- Demand base: ASD prevalence ≈2.8% of children (CDC). Cohort aging implies multi‑year service tails (early intervention, school‑age, transition services).
- Service intensity: Early intensive behavioral intervention commonly prescribes 20–40 hrs/week; payers increasingly individualize hours by need. Actual realized hours often below authorization due to staffing and attendance.
- Monetization: Realized reimbursement per hour varies materially by payer and state (commercial typically higher than Medicaid; subject to medical‑necessity and code mix). Given wide variation and limited public rate transparency, TAM should be modeled bottom‑up by state and payer.
- Practical sizing formula for diligence: TAM ≈ (eligible members engaged in ABA) × (avg realized hrs/week) × (52) × (avg realized $/hr). Build ranges by state/payer using published fee schedules, internal claims (if available), and authorization/utilization norms.
Competitive/structural context
- Fragmented, local markets with pockets of density around metro areas and military bases (TRICARE). Scale benefits hinge on payer contracting leverage, clinician recruiting pipelines, standardized clinical ops, and RCM.
- School systems provide some services under IDEA but remain capacity‑constrained; families frequently seek center‑ or home‑based ABA to supplement IEPs, sustaining private‑market demand.
Implications for investment thesis and next steps
- Portfolio positioning
- Favor states with: (a) adequate Medicaid fee schedules and predictable UM rules, and/or (b) higher commercial mix and employer density; avoid heavy exposure to low‑rate, high‑friction Medicaid MCO markets without offsetting density advantages.
- Prioritize center‑based models (where permitted and clinically appropriate) for scheduling efficiency; complement with in‑home strategically (mindful of EVV/admin drag).
- Value creation levers
- Build durable clinician pipelines (university partnerships, paid RBT training, BCBA supervision capacity) to unlock organic growth; invest in retention (career ladders, caseload management) to protect gross margin.
- Strengthen revenue cycle (authorization automation, documentation QA, denial analytics) to mitigate UM risk and convert authorizations to cash.
- Develop outcomes and family‑reported measures to meet payer demands (TRICARE, commercial pilots) and support differentiated contracting.
- Diligence priorities
- State‑by‑state rate and policy map (Medicaid FFS/MCO, commercial UM rules, telehealth allowances; TRICARE penetration by market).
- Payer mix and realized rates vs. cost to serve (by code); site‑level unit economics and ramp curves; denial rates and reasons.
- Workforce metrics (vacancy/turnover, supervision ratios, training throughput) and pipeline agreements.
- Compliance posture (CPT coding accuracy, EVV readiness, documentation standards) and audit history.
Potential Trends
Technology platform–driven trends (decision-oriented)
| Trend | What to watch / named examples | Supporting datapoints / citations | Implications for investors |
|---|---|---|---|
| Consolidation of ABA practice-management/EHR | Platform roll-ups anchoring ABA: CentralReach (Insight Partners), Therapy Brands incl. Catalyst (KKR), RethinkFirst; point solutions (Motivity, AlohaABA, Accupoint) integrating via APIs | Insight Partners acquired CentralReach (2021); KKR acquired Therapy Brands (2021) | Consolidation favors scaled vendors with cross‑sell (RCM, outcomes, training). Potential buy‑and‑build around niche workflow gaps (authorizations, outcomes, staffing). Vendor concentration risk for providers → opportunity for challenger platforms with open APIs |
| RCM and prior-authorization automation | Built-in RCM in CentralReach/Therapy Brands; independent PA/RCM automation vendors aligning to payer APIs | CMS 2024 Prior Authorization Final Rule mandates electronic PA APIs and faster decisions (7 days standard; 72 hours expedited) for Medicaid/CHIP/MA by 2027 | Medicaid-heavy ABA providers gain from automated PA/UM; platforms with payer-connectivity moats can reduce DSO/denials—key value creation lever in roll-ups |
| Hybrid care (in‑clinic/home) and telehealth parent‑mediated models | Telehealth modules in EHRs (RethinkBH, CentralReach add‑ons, Motivity); asynchronous caregiver coaching content | Systematic reviews report positive outcomes for telehealth-delivered autism interventions, especially caregiver-mediated approaches | Hybrid models expand TAM where staffing is tight and travel time is high; tele‑parent training creates lower‑acuity product tiers and de-risks capacity shocks |
| Outcomes measurement and accreditation baked into platforms | CASP outcome frameworks; accreditation bodies (ACQ, BHCOE) embedding standards; EHR vendors adding goal‑attainment scaling and dashboards | Payers/public purchasers increasingly seek quality signals; emerging standards from CASP; ACQ/BHCOE accreditation gaining visibility | Outcome reporting likely to become table stakes for payer contracting; platforms enabling standardized measures can drive rate negotiations and preferred network status |
| Workforce enablement (training, scheduling, retention analytics) | RBT/BCBA training libraries (CentralReach Learn, RethinkFirst, Relias integrations); AI-assisted scheduling/route optimization | ABA demand outpaces supply; BACB data show sustained growth in certificants and employer demand; CDC prevalence now ~1 in 36 children | Tools that compress onboarding time, reduce cancellations, and raise therapist utilization create immediate EBITDA lift in de novos and under-optimized clinics |
| Earlier digital diagnosis expanding the funnel | FDA-authorized diagnostic aids: Cognoa Canvas Dx (2021), EarliTec eye‑tracking device (2022) enabling earlier identification | CDC estimates ASD prevalence at ~2.8% of 8‑year‑olds; earlier identification supports earlier ABA starts | Platforms that integrate referral intake → benefits verification → scheduling can capture upstream demand; partnership routes with pediatric/primary care and device makers |
| Program‑integrity tech and visit verification | States/payers tightening controls; GPS/time verification, audit trails, standardized treatment plans within EHRs; Florida’s BA program integrity actions as precedent | Florida Medicaid implemented heightened oversight for BA services; payers increasing UM scrutiny | Providers with robust auditability (time/location/clinical justification) lower recoupment risk; software with defensible documentation becomes a compliance moat |
| School‑based delivery channel digitization | School Medicaid billing modules; IEP/ABA data integration; district contracting workflows | CMS 2023 guidance broadens Medicaid reimbursement for school health services | Opening of school channel favors vendors that bridge IEP systems and RCM; adds counter‑cyclical public‑payer mix and new enterprise customer segment |
| Multi‑discipline convergence (ABA + SLP/OT/psych) on one stack | Therapy Brands multi‑therapy stack; CentralReach acquisitions to support special education/transition; integrated scheduling/RCM across disciplines | PE-backed platforms expanding beyond ABA through M&A and product modules | Cross‑discipline platforms command higher ARPU and lower churn; acquisition theses: tuck‑in niche tools (assessment libraries, caregiver apps) and expand into adjacent rehabs |
Technology Suppliers
Landscape snapshot and sizing
- The ABA software stack is anchored by a few ABA-specific platforms plus horizontal health IT (clearinghouses, EVV, telehealth). Vendor concentration is highest in end-to-end EHR/PM + ABA data collection, where CentralReach and Therapy Brands (Catalyst + AccuPoint) are widely adopted.
- Sizing proxy: tens of thousands of BCBAs and hundreds of thousands of RBTs in the U.S. create a large installed base for seat-based SaaS; autism prevalence at ~1 in 36 children sustains clinic formation and software demand. Exact software TAM is not published; a directional approach ties per-seat SaaS across BCBA/RBT/admin users to a multi-hundred-million-dollar U.S. market with mid-teens growth, supported by 50-state insurance coverage mandates for autism services.
Key ABA-focused technology suppliers (representative, not exhaustive)
| Category | Company (parent) | Flagship product(s) | Core modules/capabilities | Target segment | Ownership / recent M&A notes |
|---|---|---|---|---|---|
| End-to-end ABA EHR/PM + clinical data | CentralReach | CentralReach platform; CR Practice Management; CR Clinical; CR RCM; CR Institute | Scheduling, authorizations, billing/RCM, ABA data collection (DTT), outcomes, parent portal, payroll, learning/CEU | Mid-market to enterprise ABA providers; IDD/Autism orgs | Majority growth investment by Insight Partners (2021). Tuck-ins incl. Thread Learning (2018), BehaviorSoft (2020), and avail Support (2021). |
| End-to-end ABA EHR/PM + data | Therapy Brands | Catalyst (ABA data collection), AccuPoint (PM/EHR), WebABA (BH EHR) | ABA data collection, session notes, scheduling, claims/billing, RCM services | SMB to mid-market ABA providers | KKR acquired Therapy Brands (2021). Catalyst (formerly DataFinch) and AccuPoint are core ABA brands under Therapy Brands. |
| End-to-end ABA PM + parent training | Rethink Behavioral Health (RethinkFirst) | Rethink BH | Scheduling, authorizations, billing, ABA treatment planning/data, parent training content, telehealth | SMB to mid-market ABA providers; payers/schools also served | Privately held; broadened suite spanning provider, payer, and education segments. |
| ABA clinical data platform | Motivity | Motivity | Modern ABA data collection (DTT, naturalistic teaching), program templates, analytics, parent portal, APIs | Providers seeking standalone clinical data that integrates with PM/EHR | Independent vendor focused on usability and integrability. |
| ABA PM/EHR for SMB | AlohaABA | AlohaABA | Scheduling, EVV support, authorizations, billing, payroll exports, parent portal | SMB ABA clinics; startups | Independent; cloud-first with emphasis on ease of implementation. |
| Multidisciplinary therapy EHR incl. ABA | ClinicSource | ClinicSource | Documentation, scheduling, billing, telepractice; supports ABA, OT, PT, SLP | Multi-discipline therapy clinics that include ABA | Independent; long-standing therapy EHR with ABA workflows. |
| ABA PM/EHR + RCM | CodeMetro | NPAWorks (PM/EHR), BillMax (RCM) | Scheduling, authorizations, billing/RCM, payroll, documentation | SMB to mid-market ABA providers | Independent vendor focused on ABA; offers outsourced billing (BillMax). |
| Curriculum & assessment (ABA) | NECC | ACE ABA Software | Evidence-based ABA curriculum, assessments, lesson plans, data tools, training | Providers, schools, and centers adding structured curricula | Developed by New England Center for Children (nonprofit). Widely used curriculum library. |
| Curriculum (ABA) | Skills Global | Skills for Autism | ABA curricula, skills tracking, treatment planning, parent portal | Providers and schools seeking off-the-shelf curricula | Commercial curriculum platform originating from CARD’s research; sold via Skills Global. |
| Assessment (ABA) | AVB Press | VB-MAPP App | Digital VB-MAPP assessment, milestones, barriers, tracking | Providers and schools that use VB-MAPP methodology | Official digital implementation by AVB Press. |
| Training/CE for ABA/RBT/BCBA | Relias | Relias Learning | CEU content, onboarding, compliance training for behavioral health/ABA | Providers needing CEUs and standardized training | Broad BH footprint; ABA-specific catalogs available. |
| Training/CE | CentralReach | CR Institute | CEU courses, RBT training, supervision content | Providers building in-house learning + CE | Integrated with CentralReach ecosystem. |
Horizontal infrastructure commonly used by ABA providers (claims, EVV, telehealth)
| Function | Company | What it provides | Relevance to ABA |
|---|---|---|---|
| Clearinghouse/RCM rails | Waystar | Eligibility, claims submission/EDI, remits, analytics | Core for commercial/Medicaid billing; integrates with ABA EHRs |
| Clearinghouse/RCM rails | Change Healthcare (Optum) | Clearinghouse, EDI, payment rails | A key national network; 2024 cyber incident highlighted concentration risk in claims workflows |
| Clearinghouse/RCM rails | Availity | Multi-payer portal, EDI/clearinghouse | Alternative to diversify payer connectivity and mitigate single-vendor risk |
| EVV (state-mandated in some Medicaid programs) | Sandata | Electronic Visit Verification platform and state aggregators | Required for certain ABA/habilitative services depending on state rules; many ABA orgs must integrate |
| EVV | HHAeXchange | EVV, authorization management, billing to MCOs | Select states/MCOs require or prefer integration for Medicaid ABA |
| Telehealth | Zoom for Healthcare | HIPAA-enabled video with BAA | Used for supervision, parent training, and some ABA sessions |
| Telehealth | Doxy.me | HIPAA-appropriate telehealth with BAA | Low-friction telehealth option for smaller providers |
Competitive dynamics and takeaways
- Consolidation at the core: CentralReach and Therapy Brands anchor the stack; they compete on breadth (PM + clinical + RCM + learning) and integrations. RethinkBH competes with a content-rich parent training and payer/school adjacency.
- Sticky clinical workflows: ABA data collection (e.g., Catalyst, CentralReach Clinical, Motivity) embeds programs, targets, and historical outcomes, raising switching costs. Curriculum platforms (ACE, Skills) deepen stickiness where adopted.
- Payer/Medicaid plumbing is critical: Clearinghouse selection and EVV compliance vary by state; the 2024 Change Healthcare outage showed systemic risk in single points of failure, pushing providers to seek redundancy (e.g., Availity/Waystar) and tighter RCM services.
Implications for investment thesis / next steps
- Buy-and-build within the ABA software stack: Target point solutions (assessment/curriculum, EVV connectors, outcomes analytics) with proven integrations into CentralReach/Therapy Brands, and consolidate to create a neutral layer with payer connectivity and state EVV coverage.
- RCM expansion: Evaluate specialist ABA RCM platforms/services (including those attached to PM vendors) to capture wallet share; diligence claims mix (Medicaid MCO vs. commercial), denial rates, and reliance on any one clearinghouse.
- Product wedge opportunities: Modern, API-forward clinical data tools (e.g., Motivity-type) and curriculum/assessment content bundles can win greenfield SMB logos and upsell into mid-market via integrations.
- Diligence priorities: Customer reference checks across top 50 ABA providers; integration maps with state EVV hubs; vendor concentration and outage playbooks; roadmap for analytics/outcomes reporting that align with payer demands.
Multiple / Valuation Expectations
Book a demo to continue reading the rest of this report and see how Scend generates custom market research, segmentation, and buyer-side intelligence.
Consolidation Chart
Book a demo to continue reading the rest of this report and see how Scend generates custom market research, segmentation, and buyer-side intelligence.
Relevant Precedent Transactions
Book a demo to continue reading the rest of this report and see how Scend generates custom market research, segmentation, and buyer-side intelligence.
Upcoming Conferences
Book a demo to continue reading the rest of this report and see how Scend generates custom market research, segmentation, and buyer-side intelligence.
Relevant Bankers
Book a demo to continue reading the rest of this report and see how Scend generates custom market research, segmentation, and buyer-side intelligence.